![]()
![]()
![]()
Warning : Use the following information at your own risk. While accuracy is one my goals, there is always the possibility that some of the information could be wrong. There could be typos. I could also be severely mistaken in some of my knowledge. This site is meant to help clarify certain concepts of ECG and at no point should any life-or-death decision be made based upon the information contained within. Remember, this is just some page on the internet. (If you do find errors, please notify me by feedback.)
When using ECGs to determine what arrhythmia (if any) a patient has, it would be great if we could simply look at it and immediately recognize the rhythm. Perhaps you can do so successfully, but this is not to be encouraged. Instead, you should use a system so that your interpretations of ECG after ECG will be consistent.
![]()
The Paper
|
|
|
Figure 4-1 : The classic ECG rhythm |

|
|
An ECG is printed on paper covered with a grid of squares. Notice that five small squares on the paper form a larger square. The width of a single small square on ECG paper represents 0.04 seconds. To successfully interpret ECGs, you must have this value committed to memory. Do this now. If each small square represents 0.04 seconds, then a second will be 25 small squares across. If you print out a minute's worth of your heart's electrical activity, the paper would be 1500 small squares wide. If something on an ECG is, let's say, 12 small squares in width, that means that it lasted 12 x 0.04, or almost half a second. A common length of an ECG printout is 6 seconds; this is known as a "six second strip." | |
|
Figure 4-2 : A small square is 0.04 seconds |
The width of one small square is 0.04 seconds (which is equal to 40 milliseconds).
In figure 4-1, look for the baseline. It is the line that would be perfectly straight and horizontal if not for those vertical deflections. This is called the isoelectric line. On a single ECG strip, the isoelectric line is usually about mid-height. The exact vertical position on the paper can vary from ECG to ECG. When looking at a rhythm, imagine the isoelectric line superimposed on top of the rhythm.
The "height" of an ECG wave is called its amplitude. The isoelectric line is considered to have an amplitude of zero. Anything above the isoelectric line is positive; below the line is negative.
While the horizontal parts (i.e. the X-axis) of an ECG measure time, the vertical parts (a.k.a. the amplitude) represent the "strength" of the electricity at a given time. I put strength in quotations because what it actually measures is "voltage" along a certain path. I won't go into why I put voltage in quotations. Going back to the previous analogy, note that the heart doesn't act as one big firecracker. Instead, it's like a series of little firecrackers that go off at different times. At any given time, the electricity around the beginning of the "fuse" could be going a different direction from the electricity at the end of the fuse. (For example, when the pacemaker first fires, it is unlikely that there is any major electrical activity around the end of the path. When electricity finally reaches and depolarizes the areas near the end, the areas that were depolarized before it could already be in the process of repolarizing). The amplitude (i.e. how high or low the ECG line is) at any given time represents the sum of all of the little regions of electrical activity.
When the sum of all voltages is equal to zero, it remains on this line. Hence the dramatic "flat-lining" that is so common in television shows. Just because there are no deflections (and thus the ECG is a flat line) does not necessarily mean the patient has no electrical activity in his heart. Know that voltage can be negative. Think of negative voltage as pointing the opposite direction as its positive equivalent. If all of the voltages in the heart were cancelled out by an equal but opposite voltage, you might see a net voltage of zero. Also, if all of the voltage is pointed perpendicularly to the line of view, it will register as zero. Perhaps a more likely reason for the flat line is that the treatment provider forgot to hook the patient up to the machine. (Remember to always treat the patient and not the machine.) When the net voltage is positive, the ECG deflects above this line. When the net voltage is negative, it deflects below the line.
For a demonstration of how waves add together, see my wave summation demonstration.
![]()
The Waves
Look at the diagram below. (Note that I have superimposed a green line over the isoelectric line.) What you see is the textbook, ideal Lead II representation of the electrical activity in one heart beat. That means that this person should see about seventy five of these patterns in one minute. In the pattern, there are five letters : P,Q,R,S,T. They are in alphabetical order so they are not that hard to remember. Each one of these letters represents what is known as an ECG wave. Notice how each one of them starts and stops on the isoelectric line. The term complex is usually used to mean a group of adjacent waves.
|
|
The first little hump is known as the P wave. It occurs when the atria depolarize (i.e. trigger). The P wave (or its absence) will give you clues to where this electrical activity started (ask yourself : did it start in the sinus node, the atria, the ventricles, or somewhere in between?) | |
| The next three waves constitute the QRS complex. They represent the ventricles depolarizing. These three are lumped together because a normal rhythm may not have all three. Many times, you'll only see a R and an S. This is not abnormal. If there are less than three, how do we know which one is which? Well, the R wave is the first wave ABOVE the isoelectric line. You then name the waves in relation to the R wave. If it falls before the R wave, it is called the Q wave; after the R wave is the S wave. | ||
|
Figure 4-3 : The waves of an ECG (Note : green line is superimposed over the isoelectric line.) |
If there are no upright waves in the QRS complex (and you are sure you aren't mistaking the T wave for part of the QRS), you call the second upright wave R' (pronounced "R prime").
Everything that depolarizes must repolarize if it intends to be triggered again. The repolarization of the atria usually occurs while the QRS is occurring and is not really noticeable. The repolarization of the ventricles, however, is represented by that large hump after the QRS complex. This is known as the T wave.
Sometimes a U wave appears after the T wave. This is uncommon.
One of the first things you want to measure is the electrical rate of the heart. I have used the term "electrical" because you CANNOT measure the true heart rate with an ECG machine. The true heart rate is the rate at which the heart pumps blood. This is detected by taking a pulse. In the normal, healthy heart, the true rate will coincide with the electrical rate. However, there are many reasons why there might not be a corresponding pulse to go with an electrical beat.
![]()
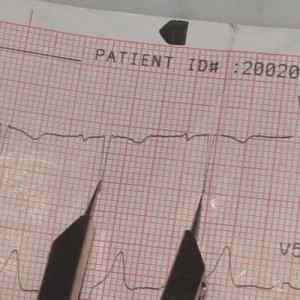
The Caliper
| An ECG caliper (sometimes plural like scissors) is a tool that helps measure certain values. It usually has no measuring ability of its own, but allows you to set its width and then measure it against a more convenient portion of the ECG paper. Although the tool is often marketed as an "ECG caliper", it is really a general tool that can be used for many different things. In the non-ECG world, I've heard them called "dividers." |
|
|
|
Figure 4-4 : A typical ECG caliper |
 |
Step 1. Position the two arms of the caliper on the each end of the width you intend to measure. Make sure that the arms are perfectly horizontal (i.e. on the same vertical line). | |
| Figure 4-5 : Positioning the arms of a
caliper on two adjacent QRS complexes.
|
||
 |
Step 2. After you have positioned the caliper arms, do not let them move (relative to each other). This would defeat the purpose of using the calipers. Find a place on the paper that it will be easy to see the lines. Keeping the two caliper arms on the same vertical level, place the left arm of the caliper on the left side of a big square. Count the number of small squares between the two arms. (Remember that each big box is five small squares.) Multiply this by 0.04 to convert the number of small squares into seconds. | |
| Figure 4-6 : Moving the caliper to a more convenient place to count squares. |
Of course, calipers are not absolutely necessary but they do make the job of ECG interpretation much less tedious.
What is there to measure on an ECG? Well, for basic Lead II rhythm interpretation, there are three things you want to be sure to measure every ECG. They are : R-R interval, the PR interval, and the QRS width. We will learn later what these values mean. For now, concentrate simply on being able to measure them correctly.
![]()
The R-R interval
This is a measurement of the distance between two consecutive beats. The R wave is usually chosen to do this because it is the tallest and most conspicuous. In most rhythms (including normal rhythms), the R-to-R interval will be the same as the P-to-P distance, or the distance between any two analogous points on consecutive beats.
If the R-R interval is constant, no matter what two consecutive beats we chose, we say the rhythm is regular. Do not confuse the terms regular and normal. The term regular does not indicate whether the rate is normal, fast, or slow, just that the beats are evenly spaced. Irregular, therefore, means that waves are not evenly spaced. Think of someone you know who has absolutely no rhythm. Imagine this person trying to clap his or her hands to the beat of a song but failing miserably. Some claps are too close together, some are too far apart. This is what should come to mind when you hear the word irregular in the context of ECG.
Rate is expressed in beats/min. It probably isn't accurate to say "beats/min" in this case because you cannot tell if the heart is actually pumping blood simply from an ECG. When using only the ECG, it is best to refer to what you measure as the electrical rate and leave out the word beats, saying simply "per minute" as in "The electrical rate is 75 per minute."
How do you determine rate of the rhythm?
- The more accurate method : 1500 / (# of small squares in R-R interval)
This should only be used if the rhythm is regular. If the R-R interval fluctuates from beat to beat, then it should be obvious why you cannot use this formula. (We use the number 1500 because there are 1500 small squares in a minute.)
- The quick estimation : count the number of electrical beats in a
six-second strip and multiply that number by 10.
This should be used if the rhythm is not regular. It is not as accurate as method #1. (If you use this method, every rate you get will be evenly divisible by 10. The true heart rates tend not to be so "computationally friendly.") Never assume that a strip is six seconds; check for tick marks or count the large squares.
![]()
The PR interval
|
|
Often abbreviated PRI, the PR interval is the distance (time) between the beginning of the P wave and the beginning of the QRS complex. The R in PR interval refers to the R wave, but it is not always measured to that wave. It actually ends at the beginning of whatever the first wave in the QRS complex is. It might have been more accurately called "P-to-QRS interval," but that would have been a mouthful. A normal PRI should be in the range of 0.12 - 0.20 seconds. Memorize this. Since we already know that each square represents 0.04 sec, we are able to calculate that 0.12 seconds is three squares and that 0.20 seconds is five squares. |
|
|
Figure 4-7 : The PRI |
In a normal rhythm, every P wave will be followed by a QRS complex. This is the same thing as saying that the ratio of P waves : QRS complexes is 1 : 1. In some rhythms, however, you don't see this 1:1 ratio. The absence of this 1:1 ratio provides a major clue as to what rhythm may be present. In some cases, it will be impossible to measure the PRI.
![]()
The QRS width
Another important measurement is QRS width (also called QRS duration). This is the measurement from the beginning of the first wave in the QRS to the end of the last wave in the QRS. A normal QRS width should be less than 0.12 s. Some people say it should be less than 0.10 s, but both groups agree that it should be less than 0.12 s. (In order to confuse the reader, I have decided to use both values and frequently switch back and forth.) Below this value (and thus of normal duration) it is called a narrow QRS. When a QRS is longer than 0.10 - 0.12 seconds, it is called a wide QRS.
 |
|||
| The QRS begins at the
point where the PRI stops. This is either the beginning of the Q wave; if there is no Q wave,
it starts at the beginning of the R wave.
|
|||
| The end of the QRS can be tricky to find. The S wave (or whatever the last wave in the QRS is) ends at the beginning of what is called the ST segment. This point is sometimes called the J point. In the usual "textbook" ECG, the S wave ends on the isoelectric line. (On figure 4-7, the QRS is easy to spot.) However, in many cases, the ST segment is not so flat. In Figure 4-8, notice that the ST segment starts below the isoelectric line. The J point (i.e., the end of the QRS complex) appears like a bend in the road. | |||
|
Figure 4-8 : The width of the QRS complex (Note the non-horizontal ST segment)
|
©2004 Mauvila.com